What Are Your Odds Of Getting HIV?
What Are The Chances of Getting HIV Sexually?
Percentages from Statisticians
Author & columnist, featured on HBO, NPR, and in The New York Times
What are the odds of getting HIV from a one-time encounter?
How about multiple encounters?
How can you calculate the risk you're taking? Is there a solid number or statistic that can help you understand the chances of catching HIV? These are the blunt questions that often go unasked but loom large in the back of every gay man's mind.
Here's the number you're looking for: 1.43%.
Those are the official odds of contracting HIV in one encounter of receptive anal sex with an HIV-infected "top."
That sounds low, right? Maybe, if all you're worried about is a one-nighter you don't intend on repeating.
But if you keep having unprotected sex as the receptive partner, the numbers balloon to the point they could scare the moss off a rock. At first glance, 1.43% might seem minimal, almost negligible. But it ain't. Because the math starts to change when you look at cumulative effects.
In fact, some of the numbers--all arrived at by medical statistitians-- are going to shock you. Take a look:
The Probability of Getting HIV in Terms of Percentages
Quantifying The Odds of HIV Transmission: Oral vs. Anal, Topping vs. Bottoming
The Cumulative Risk of HIV Transmission As You Have More Partners
How HIV Percentages Escalate with More Partners
Situations That Skyrocket HIV Risk by Over 500%
The Chances of Getting HIV From A Needle Poke
SURPRISE! Unprotected Anal Sex Carries a Greater HIV Risk Than Bloody Needle Exposures
The Chances Of Getting HIV From Blood Transfusions
How Scientists Calculate The Likelihood of Getting HIV
Difference Between Prevalence Rate and Per Act Risk
What Percent of Gay Men Are HIV?
The Chances Of HIV From a One-Night Stand
(Our sister article to this one)
Why It's Important To Know Your Odds of Getting HIV
Navigating the fear and anxiety surrounding HIV is a stark reality for many in the LGBT community, a shadow that looms large over daily life and well-being. This pervasive dread isn't just about the virus itself but the heavy toll it takes on mental and physical health,. Studies show that the fear and anxiety of getting HIV contributes to internal homophobia and some awful health outcomes.
For example, gay men are 300% more likely to experience depression and 113% more likely to suffer from anxiety disorders. The toll on physical health is equally grim, with a 142% higher likelihood of developing Inflammatory Bowel Disease and a 200% increase in the risk of eating disorders.
The impact extends to addiction, with rates of alcoholism and substance abuse 178% and 122% higher, respectively. Moreover, gay men face a staggering 200% higher risk of homelessness and a heartbreaking 316% increase in the likelihood of suicide.
Understanding the odds of contracting HIV can be a powerful antidote to this fear. It's about shifting from a place of uncertainty and dread to one of informed confidence. Our guide dives deep into this complex subject, unraveling the good news and the bad, with a clear message: the fear and anxiety surrounding HIV, while understandable, can be nearly eradicated with the right knowledge and precautions.
The Chances Of Getting HIV
As we stated earlier, the likelihood of getting HIV from one encounter is 1.43%.
But how do we know this? And how much faith should we place on it?
While the Centers for Disease Control and Prevention (CDC) often references a figure like 1.36% for the per-act risk of HIV transmission through receptive anal intercourse, in this article, we're focusing on the slightly higher estimate of 1.43%. This choice is intentional, reflecting a consensus from a range of studies and providing a more cautious estimate for our discussion.
By the way, this number was arrived at by looking at single guys and those coupled in sero-discordant relationships.
The desire to find out the chances of contracting HIV began in earnest during the height of the AIDS epidemic in the 1980s and 1990s. Initially, the scientific community grappled with understanding how HIV was transmituted and what factors influenced its spread.
Early estimates were rough at best, as researchers scrambled to collect data amidst a rapidly evolving crisis. Over time, as data collection and research methodologies improved, these figures became more refined. Large-scale studies and meta-analyses began to offer more precise estimates, considering variables such as viral load, condom use, and other protective measures.
The refinement of these figures over the years has been a testament to the scientific community's dedication to understanding HIV transmission. The move from broad, generalized risk estimates to more nuanced figures like the 1.43% reflects an increasing sophistication in epidemiological modeling and a better understanding of the virus's behavior in different contexts.
So, how do scientists use these per-act figures, and why are they important? At their core, these statistics serve multiple purposes in the fight against HIV/AIDS:
Informing Public Health Strategies
Per-act risk figures are crucial for developing targeted public health campaigns. By understanding the relative risks of different behaviors, health organizations can tailor their messaging and prevention strategies more effectively.
For example, highlighting the higher risk associated with receptive anal intercourse without protection can underscore the importance of condom use or PrEP (Pre-exposure Prophylaxis) in these contexts. Read our post, Why Should I Take PrEP If My Odds of Getting HIV is 1.43%? to understand the nuances. And our post on how the U=U Movement is reshaping the sexual landscape.
Guiding Individual Decision-Making
On a personal level, these figures empower individuals to make informed choices about their sexual health. Knowing the specific risks associated with different activities (the odds of contracting hiv after one exposure of oral or anal sex) allows people to assess their personal risk tolerance and take appropriate precautions to protect themselves and their partners.
Shaping Policy and Funding
At the policy level, precise risk estimates help direct funding and resources to where they're needed most. Understanding the nuances of HIV transmission supports the allocation of resources to high-impact prevention and treatment programs, research into new interventions, and support services for those living with HIV.
Advancing Scientific Research
For researchers, these figures provide a baseline for further investigation. They can explore the impact of various interventions, like the effect of antiretroviral therapy on reducing transmission risk, or the efficacy of new prevention technologies. This ongoing research is vital for keeping the public health response to HIV dynamic and responsive to new challenges.
Supporting Clinical Practice
In clinical settings, healthcare providers use these risk figures to counsel patients on prevention, testing, and treatment. For serodiscordant couples, where one partner is HIV-positive and the other is HIV-negative, understanding per-act risks can guide discussions on safe sex practices and risk reduction strategies.
While the per-act risk figures like the 1.43% for HIV transmission provide a snapshot of risk (the chances of contracting HIV after one exposure), their value extends far beyond a simple statistic. They are a tool for education, a foundation for policy, and a catalyst for ongoing research. As our understanding of HIV continues to evolve, so too will these estimates, shaping our collective response to a virus that has challenged us for decades.)
The Risks of Contracting HIV: Oral vs. Anal, Topping vs. Bottoming
What Are The Chances Of Catching HIV?
Below you'll see the odds ranked from least to most likely:
| Activity | Odds of Catching HIV (One Encounter) |
|---|---|
| Insertive anal sex, no condom, undetectable viral load | 0% |
| Receptive fellatio, no condom, viral load not known | 0% to 0.04% (1 in 2500) |
| Insertive anal sex, no condom | 0.11% (1 in 909) |
| Needlestick injury with contaminated blood | 0.23% (1 in 435) |
| Injecting drug use | 0.63% (1 in 158) |
| Receptive anal sex, no condom | 1.43% (1 in 70) |
Are You Shocked At How Low These Numbers Are?
Pause for a moment. The likelihood of acquiring HIV from a single encounter stands at 1.43%?
Contrary to popular belief, which might estimate the risk to be as high as 20, 30, or even 40%, the actual figure is significantly lower. How can this be?
This statistic challenges widespread perceptions and underscores a critical gap in public understanding. The reluctance among experts to publicize such a low probability stems from a legitimate concern: the potential undermining of preventive measures like condom use and PrEP adherence.
However, it's imperative to approach this figure with caution. The 1.43% risk is not a blanket assurance for all sexual encounters.
Yes, this startling statistic--1.43%-- shatters the prevailing myths and whispers that have fueled our collective anxiety. The scientific community, treading carefully, has harbored concerns that full transparency might inadvertently lead to a decline in the diligent use of condoms and PrEP.
However, this figure is not a carte blanche for reckless abandon. Beneath the surface of this seemingly straightforward statistic lies a complex web of implications, hinting at a narrative that spells DANGER the way that sign in Los Angeles spells "Hollywood"--clear for all to see.
Gird your loins for danger you're about to see in a single chart.
The Cumulative Risk of HIV Transmission As You Have More Partners
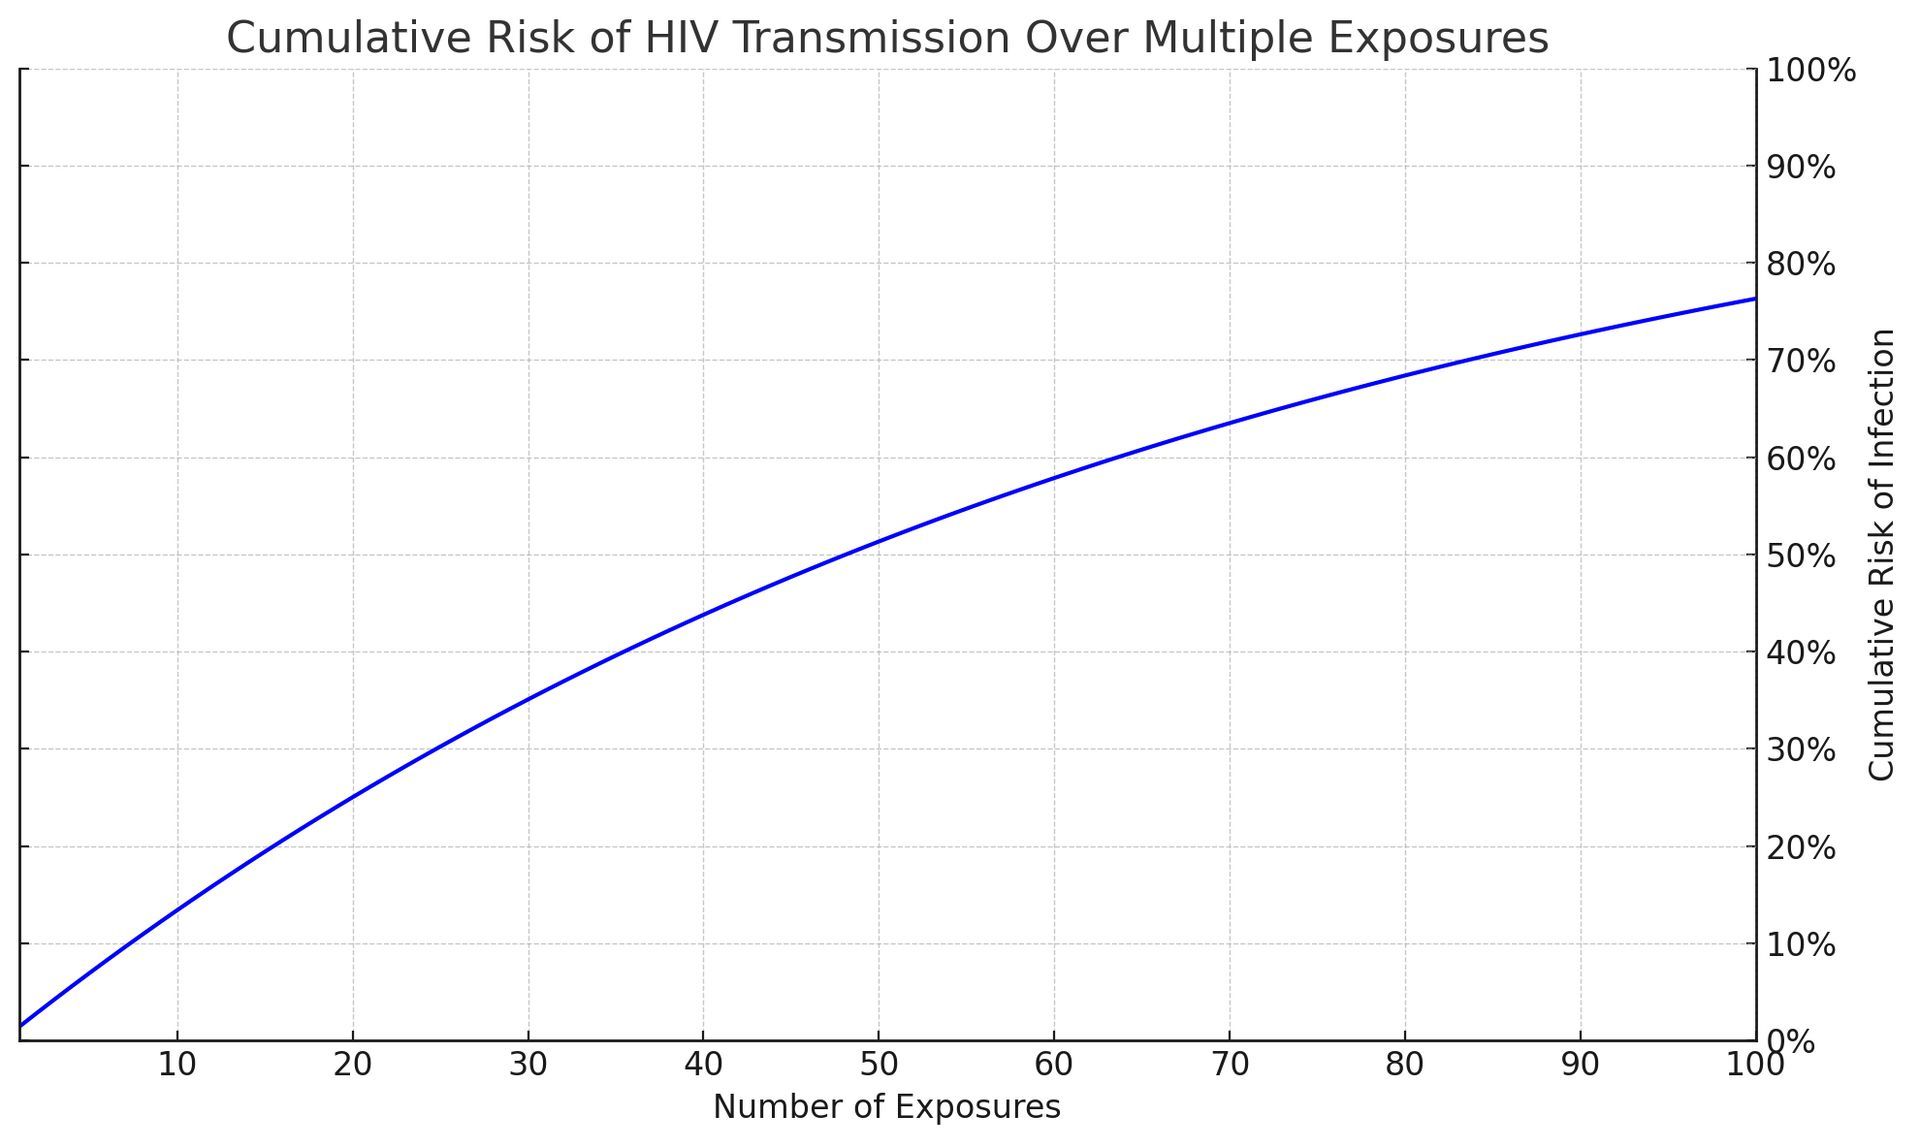
Using a per-case odds of 1.43% (or 143 per 10,000 exposures), the cumulative risk for HIV infection as the number of partners grows from 1 to 100 can be calculated. The cumulative risk can be determined using the formula:
1−(1−per act risk)n
Where: per act risk = 1.43%
As you can see, with each additional exposure, the cumulative risk of transmission grows significantly. This illustration is a powerful tool in conveying the importance of consistent preventive measures, even when individual risks per act might seem low.
It underscores the message that while a single act might carry a relatively small risk, the risk does not reset with each new exposure but instead accumulates, highlighting the critical need for ongoing protection strategies like condom use and PrEP.
Odds of HIV Infection Chart for Multiple Partners
Sometimes a chart can be more understandable. So, using the same formula, here's what it looks like:
| Number of Partners | Odds of Infection Based On Cumulative Risks |
|---|---|
| 1 | 1.43% |
| 5 | 6.86% |
| 10 | 13.08% |
| 20 | 24.56% |
| 50 | 53.57% |
| 100 | 76.32% |

How the 1.43% Per-Act HIV Risk Increases with More Partners
Shouldn't the 1.43% "Per Act" Figure Stay the Same No Matter How Many Partners You Have?
Why doesn't the risk stay at 1.43% per act when you have more partners? Lets' say you have five different partners. Each partner has a 1.43% chance of infecting you. Let's say that these five partners are spread over the course of three months. Why wouldn't the cumulative odds stay at 1.43%?
Great questions.
Understanding why the risk doesn't remain at 1.43% per act, even when partners are spaced out over time, requires looking at how cumulative risk works in the real world, beyond the math.
What Are The Odds Of Getting HIV? A Metaphor
Imagine you're playing a game of chance where you have a 1.43% chance of drawing the short straw each time you play. The first time you play, your odds of drawing that straw are exactly 1.43%. But here's the catch: each time you play, you're facing a new, independent chance of drawing the short straw. The game doesn't remember your previous attempts; each play is a fresh start with the same 1.43% risk.
Now, apply this to the scenario with multiple partners. Each time you engage in sexual activity with a partner, it's like playing a new round of the game. The fact that a month goes by before you have sex with a new partner doesn't reset your overall risk. Instead, each encounter adds another independent chance of exposure to HIV, just like each round of the game adds another chance to draw the short straw.
The key here is understanding that risk accumulates over independent events. Even though each act has the same initial risk, the cumulative effect of multiple independent chances increases the overall likelihood of encountering the risk at least once.
It's not that the risk per act changes; it's that your total exposure to potential risk events increases.
Think of it like crossing a busy street. Each time you cross, there's a small risk. Cross once, and your risk is low. But if you cross the street multiple times, your overall risk of eventually encountering a dangerous situation increases, not because crossing is riskier each time, but because you're exposing yourself to the risk more often.
So, even with gaps between partners, the principle remains the same. Each new partner represents a new "round" with its own 1.43% risk. Over time and multiple partners, these independent risks accumulate, increasing your overall chance of exposure to HIV. This real-world perspective highlights the importance of consistent protection measures, regardless of the time elapsed between partners, to manage and mitigate the cumulative risk.
Discover the groundbreaking "Undetectable = Untransmittable" revolution transforming the HIV landscape and how it will affect your sexual health.
How Certain Circumstances Can Increase The Risk Of HIV Transmission By 500% Or More
That 1.43% "Per Act" Figure Changes Dramatically Depending On Circumstances
When we talk about the likelihood of HIV transmission, numbers like a 1.43% per-act risk can seem reassuringly low. Some might think, "Wait, my chances of getting HIV from one encounter is less than 2%?! WOO-HOO!"
Others might think, "Seriously? I've got a 98.57% chance of NOT contracting HIV when I bottom for a top who's HIV?"
Before you start sending "Save The Date" announcements for the celebration, we have some sobering news.
While the 1.43% transmission risk of HIV is technically accurate, it's misleading because it's based on averages that don't necessarily apply to every individual or situation.
Let's unpack why relying on this single percentage can be deceptive and why factors like viral load and the presence of sexually transmitted infections (STIs) can dramatically alter the landscape of risk.
The Illusion of Safety in Averages
The 1.43% figure is derived from studies that average out the risk across many cases, including individuals with varying health statuses, behaviors, and preventative measures. But averages have a way of smoothing over the peaks and valleys of real life. They can hide the fact that for some people, in some situations, the chances of acquiring HIV can be much higher.
Imagine you're planning a picnic and you hear there's a 10% chance of rain. It sounds like a small risk, but if you knew a storm was directly overhead, you'd probably rethink your plans. Similarly, understanding the factors that can turn a drizzle of risk into a downpour is crucial when it comes to HIV prevention.
The Role of Viral Load
Viral load, or the amount of HIV in someone's blood, is one of those critical factors. Think of viral load as the density of raindrops in a storm: The more there are, the wetter you'll get if you're caught in it. In the context of HIV, a higher viral load means more virus available to potentially infect someone. If someone with HIV isn't on treatment or has only recently started, their viral load can be quite high, significantly increasing the risk of transmission beyond the average.
For example, scientists believe a high viral load might increase the likelihood of having HIV by 3 to 5 times, making the per-act risk range from 4.29% to 7.15% instead of the average we've been using--1.43%. Let's use the mid-point between 4.29% and 7.15% to calculate how the risks change.
Assuming a 5.2% "Per Act" Risk Factor
(midpoint between the range of 4.29% and 7.15%)
Take a look at what happens to the chances of getting infected with HIV when you take a top's high viral load into account:
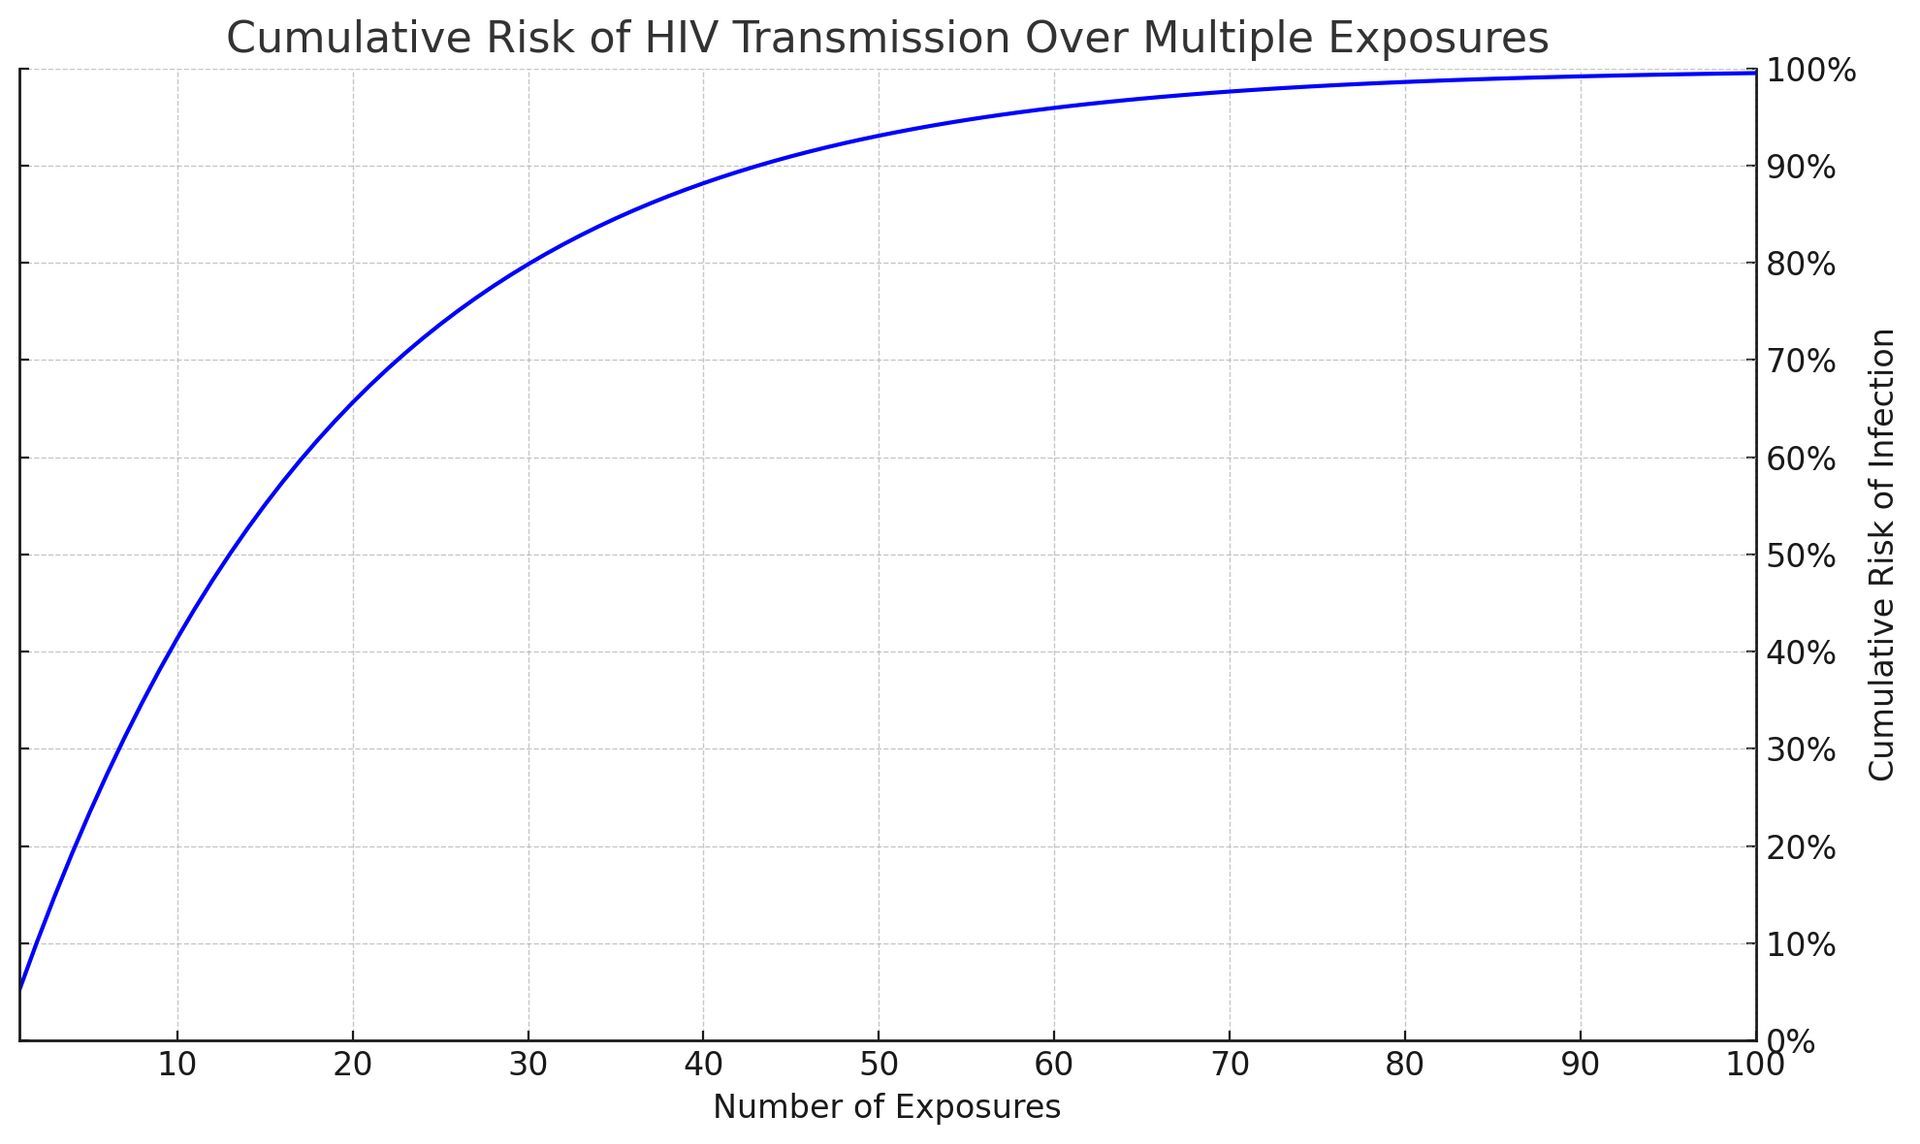
Whoa! As you can see, these numbers could scare the moss off a rock! Again the average "per act" odds of getting hiv from one night stand with unprotected sex is 1.43%. But this graph has been updated to reflect a high viral load in the insertive partner which raises the odds to 5.2% per act.
This illustrates the cumulative risk of HIV transmission over multiple exposures at this higher per-act risk, emphasizing the increased probability of transmission with repeated unprotected sexual encounters.

The Role of STI's in Increasing HIV Transmission Rates
STIs can also turn what might seem like a manageable risk into a more serious threat. When there's an STI in the mix, it's like the wind in a storm - it can make things a lot worse. STIs can cause inflammation and breaks in the protective barriers of the skin and mucous membranes, providing an easier path for HIV to enter the body. This can amplify the risk of HIV transmission, again pushing the real-world risk above the average.
Similar to viral loads the presence of an untreated STI increases the per-act risk by 2 to 5 times. That means the adjusted per-act risk could range from 2.86% to 7.15%. This would also result in substantially higher cumulative risks.
What Is The Likelihood of Getting HIV If We Included Both High Viral Load and STI's?
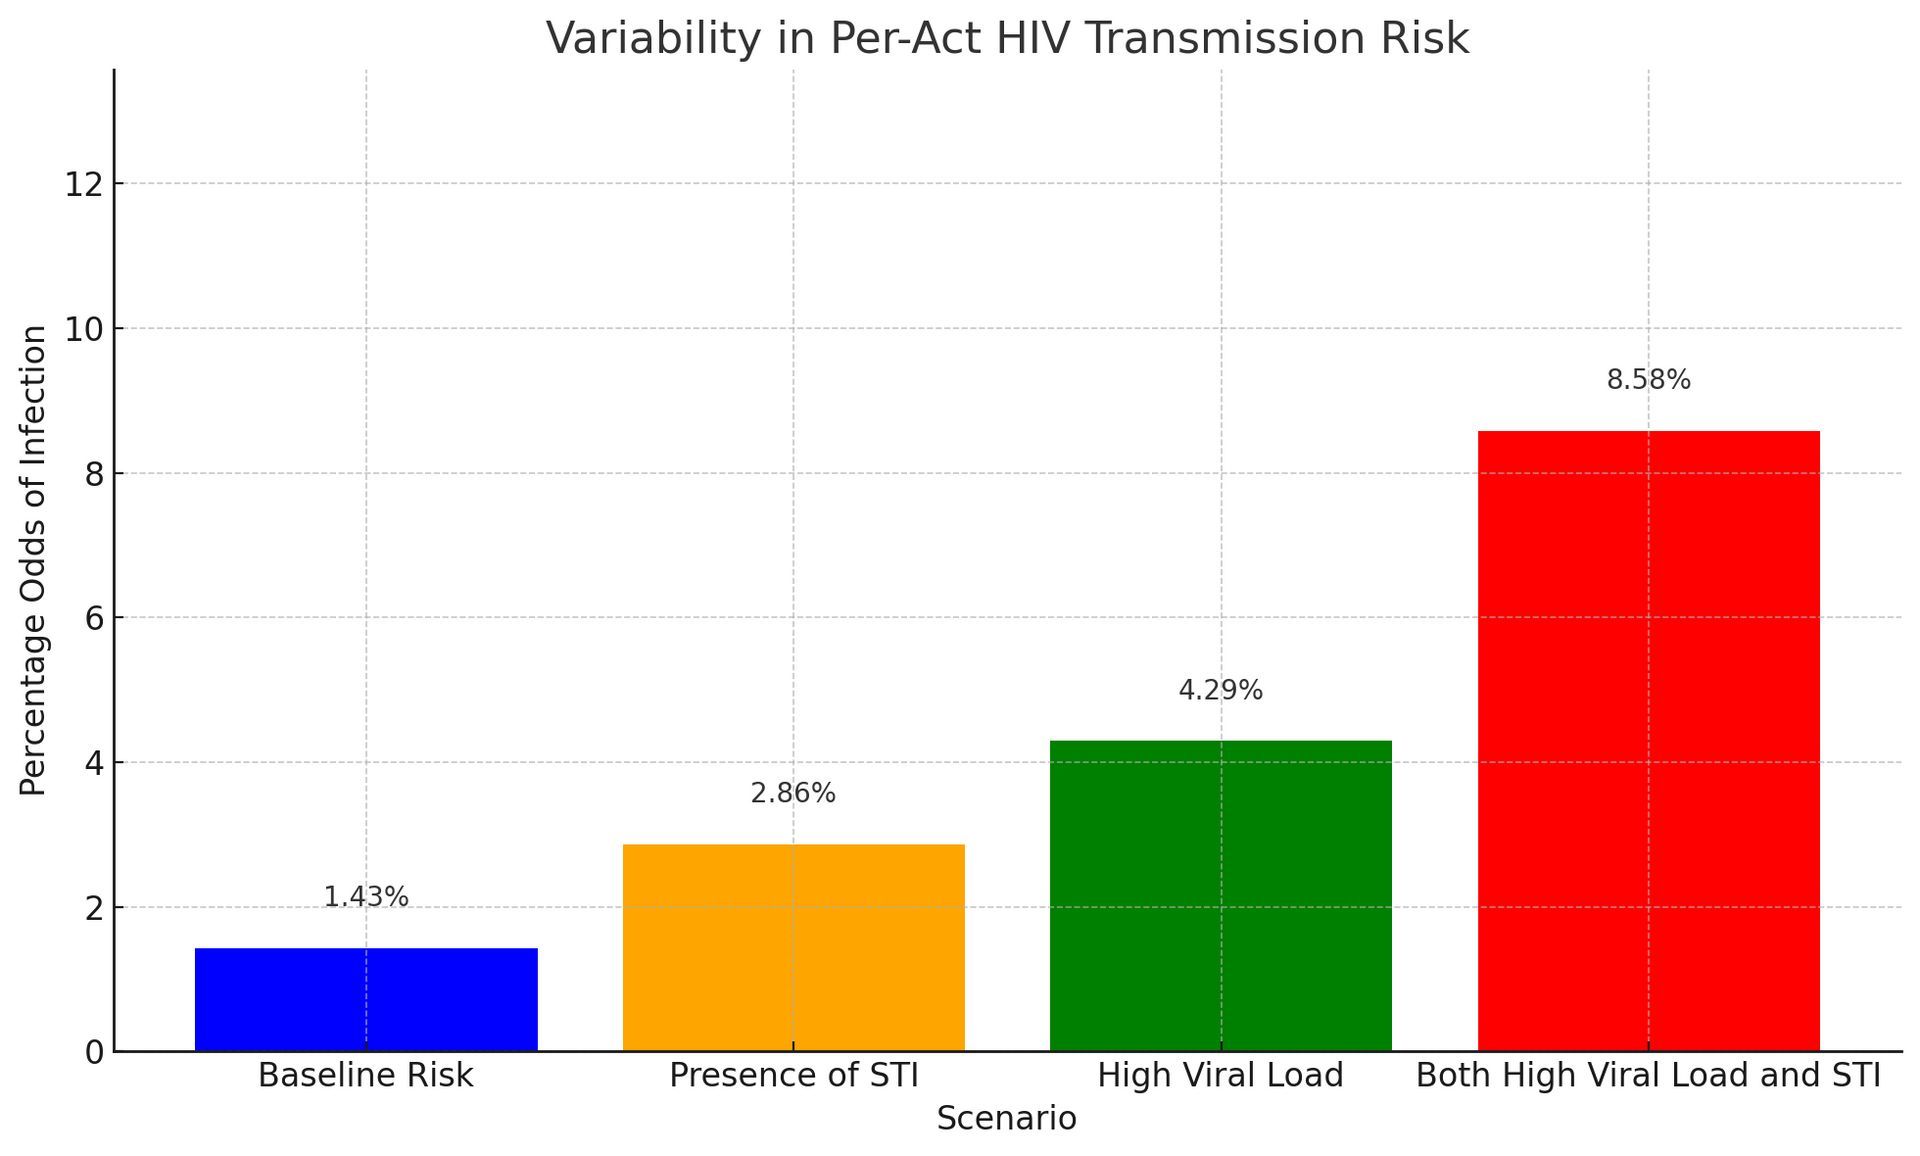
The graph starts with the baseline risk (1.43%) and progresses through the presence of an STI, high viral load, and the combined effect of both high viral load and STI.
This order visually represents an increasing trend in the odds of getting HIV from a one night stand. And how each factor contributes to elevating the risk and highlighting the compounded effect when both factors are present.
As you can see, if we include real world scenarios, the likelihood of catching HIV may be 1.43% "per act" on average. But depending on the factors we talked about, it can go to 8.58% or higher.
Suddenly, that original "per act" figure (1.43%) doesn't sound so low does it?
Now, this graph shows us the "per act" odds
of just one encounter. What happens if you have multiple encounters? What does the "cumulative effect" of repeated exposures to people with STI's and high viral loads do to your chances of getting infected?
What Are The Odds Of Catching HIV?
Here's s table showing the odds of HIV infection for up to 20 partners under various scenarios: Baseline Risk, Presence of STI, High Viral Load, and Both High Viral Load and STI. (use the scroller WITHIN the table on the right to move up and down)
| # of Partners | Baseline Risk | Presence of STI | High Viral Load | Both High Viral Load and STI |
|---|---|---|---|---|
| 1 | 1.43% | 2.86% | 4.29% | 8.58% |
| 2 | 3% | 6% | 8% | 16% |
| 3 | 4% | 8% | 12% | 24% |
| 4 | 6% | 11% | 16% | 30% |
| 5 | 7% | 14% | 20% | 36% |
| 6 | 8% | 16% | 23% | 42% |
| 7 | 10% | 18% | 26% | 47% |
| 8 | 11% | 21% | 30% | 51% |
| 9 | 12% | 23% | 33% | 55% |
| 10 | 13% | 25% | 35% | 59% |
| 11 | 15% | 27% | 38% | 63% |
| 12 | 16% | 29% | 41% | 66% |
| 13 | 17% | 31% | 43% | 69% |
| 14 | 18% | 33% | 46% | 72% |
| 15 | 19% | 35% | 48% | 74% |
| 16 | 21% | 37% | 50% | 76% |
| 17 | 22% | 39% | 53% | 78% |
| 18 | 23% | 41% | 55% | 80% |
| 19 | 24% | 42% | 57% | 82% |
| 20 | 25% | 44% | 58% | 83% |
What This Table Tells Us
Let's dive into the table we just created, which beautifully lays out how the chances of getting HIV from an infected person changes under different scenarios as you increase the number of partners. This isn't just a set of numbers; it tells a story about risk, prevention, and the importance of being informed.
At a glance, the table starts with a seemingly small number: a 1.43% risk of HIV infection with just one partner, based on the baseline risk of 1.43% per exposure. It feels manageable, right? But as we add more partners into the mix, the narrative changes. With each new partner, the risk doesn't just add up; it multiplies, reflecting how real-life risks accumulate over time.
By the time you reach 20 partners, even under the baseline scenario, the risk has jumped to 25%. It's a stark reminder that what starts as a trickle can quickly become a flood. And here's where the plot thickens: when we factor in other elements like the presence of an STI or a high viral load, the numbers tell an even more cautionary tale.
With an STI in the picture, the risk doubles right from the start, and by 20 partners, you're looking at a 44% chance of HIV infection. That's almost a flip of a coin, which is far from comforting. But it's the combination of a high viral load and an STI that truly amplifies the risk, catapulting it to an 83% chance by the 20th partner. It's a vivid illustration of how these factors interplay to escalate risk, like adding fuel to a fire.
Can You Make Fun Of HIV Without Insulting The People Who Have It?
Multiple Partners, STIs & Viral Load
Dramatically Increase The Odds of Having HIV
So, what's the takeaway from all this? First and foremost, it's a powerful reminder of the importance of protection and prevention. Condoms, regular testing, and treatments like PrEP aren't just good ideas; they're essential tools in our arsenal against HIV. They're the raincoats in our storm, so to speak.
Moreover, this table highlights the critical need for open conversations about sexual health, not just with potential partners but with healthcare providers too. It underscores the importance of being proactive about our health choices and understanding the real-world implications of our actions.
In essence, this isn't just a table of risks—it's a roadmap for responsible decision-making. It tells us that while we can't always control every aspect of our sexual health, we can certainly arm ourselves with knowledge and protective measures to significantly reduce our risks. And in the end, that's a message of empowerment and hope.
How Viral Load Affects Your Odds of Getting Infected
Imagine each HIV-positive individual carries a metaphorical "bag of seeds," where each seed represents a viral particle of HIV. The size of the bag and the number of seeds it contains can vary greatly from one person to another, depending on their viral load. A larger bag brimming with seeds symbolizes a high viral load, while a smaller bag with fewer seeds represents a lower viral load.
The Act of Scattering Seeds: Sexual Transmission
Each sexual encounter can be thought of as an opportunity to scatter seeds from this bag. In this metaphor, the act of scattering seeds equates to the potential for HIV transmission. When a person with a high viral load (a large, full bag of seeds) engages in unprotected sexual activity, the odds of seeds being scattered — and taking root — are much higher with each encounter. Essentially, the "per act" odds of transmission increase because there are more viral particles that could potentially be transferred to the sexual partner.

Viral Load and Transmission Odds
When the bag of seeds is full (high viral load), even a single act of scattering can spread a significant number of seeds, increasing the likelihood that some will find fertile ground (result in transmission). Conversely, if the bag contains very few seeds (low viral load), the chances of seeds being scattered and taking root with each act are much lower.
The Role of ART: Emptying the Bag
Antiretroviral therapy (ART) works to effectively reduce the number of seeds in the bag, aiming to reach a point where the bag is virtually empty (undetectable viral load). When an HIV-positive individual achieves an undetectable viral load through consistent and effective ART, it's as if they're going through the motions of scattering seeds, but no seeds actually fall out. This dramatically reduces the "per act" odds of transmission, making it extremely unlikely for HIV to be passed on during sexual activities.
That's why you hear phrases like "Undetectable = Untransmittable." An undetectable viral load reduces the probability of HIV transmission to zero.
Do the Odds of Getting HIV Increase If Your Partner Is From A Demographic With a Higher Prevalence of HIV?
Do the per-act odds of getting HIV for receptive anal sex partners go up if the insertive partner (top) belongs to a demographic more likely to have HIV? After all, HIV disproportionately affects the black and latino community. Take a look:
- White Gay Community: Approximately 5% of white gay and bisexual men are living with HIV.
- Black Gay Community: Around 25% of new HIV infections were among Black gay and bisexual men in 2021.
- Latino Gay Community: About 22% of new HIV infections were among Latino gay and bisexual men in 20211
- Asian Gay Community: There is no specific data on the percentage of HIV prevalence among the Asian gay community.
These percentages highlight the disparities in HIV prevalence among different racial and ethnic groups within the gay community. So back to our original question: Does the likelihood of contracting HIV rise if your partner belongs to a group with a higher rate of HIV infection?
The per-act odds of getting HIV for the receptive partner in anal sex according to the CDC is 1.36% (but remember we use 1.43% because other studies show it's higher). This risk is not specific to any demographic group and is based on the nature of the sexual activity.
While the CDC provides specific risk estimates for different sexual activities, it does not offer separate data based on demographic factors such as race or ethnicity. Therefore, the 1.36% figure is a general estimate and does not account for potential variations in risk among different demographic groups.
Should it?
Read our article,
Does the Likelihood of Contracting HIV Increase If Your Partner Is Black or Hispanic?
The Chances of Getting HIV From A Needle Poke
The sharing of needles and other drug paraphernalia stands out as one of the most hazardous non-sexual behaviors for HIV transmission. When needles or syringes are shared among individuals, the risk isn't just theoretical; it's alarmingly tangible.
The CDC estimates that the per-act risk of HIV transmission through needle sharing among people who inject drugs can be as high as 0.63%. This high rate of transmission is due to the direct exchange of blood, which may contain a significant viral load, thereby facilitating the efficient transfer of the virus.
Beyond just needles, the sharing of other drug paraphernalia, such as cookers, cotton, or water, can also pose risks. While these activities might carry a slightly lower risk than direct needle sharing, they still involve the potential mixing of blood and bodily fluids, creating avenues for HIV transmission.
Sharing Needles is Safer Than Receptive Anal Sex?
Wait, did you catch that? Having a penis inserted into your rectum is way more dangerous than injecting yourself with a bloody needle? How can that be?
Unprotected Anal Sex Is Far More Likely To Infect You With HIV Than Injecting Yourself With a Bloody Needle.
What a shocker, huh? The per-act risk of getting HIV from receptive anal sex is higher at 1.43% compared to just 0.63% from something as alarming as injecting yourself with a needle that's been used by someone else.
It's one of those things that make you go, "WTF, Really?" Let's break it down into bite-sized pieces to see why this is the case.
First up, the inside of your bum has this super thin lining that can easily get little tears in it, making it almost like an open door for HIV to waltz right into your bloodstream. Plus, this area is packed with immune cells that HIV just loves to target. So even though it might not seem like it, this kind of sex without protection is like rolling out the red carpet for HIV.
Chances Of Getting Hiv From Infected Needles
Now, onto the
needle scenario. You'd think that sharing a needle straight-up swaps blood and would be super risky, right? But here's the kicker: not every needle with someone else's blood on it has enough HIV to cause an infection. And the amount of blood that gets transferred by a needle is teeny-tiny. Plus, some folks who use needles might clean them out or have access to clean ones, which lowers the risk quite a bit.
And here's where the plot thickens with viral load. That's just a fancy term for how much HIV is in someone's blood. If someone's taking their HIV meds and keeping their viral load super low, the risk of passing on the virus drops a lot, even if they accidentally share a needle.
But wait, there's more! The frequency and context matter too. Think about it: if more people are having unprotected sex than sharing needles, it makes sense that more HIV transmissions happen that way. Plus, folks might be taking steps to reduce the risk when they share needles, like using those needle exchange programs.
And last but not least, let's talk about the biology of it all again. Your skin and the tissues under it are pretty tough, so a needle has to work harder to get HIV into your system. But with anal sex, the virus has an easier path to get where it wants to go.
Yes, it's true, the chances of getting HIV from a needle poke is far less than having unprotected, receptive anal sex.
Go figure.
The Chances Of Getting HIV From Blood Transfusions
In countries with advanced blood screening processes, the risk of HIV transmission through blood transfusions has become extremely low.
For example, in the United States and other developed countries, the risk is estimated to be about 1 in 1.5 million transfusions, which translates to approximately 0.000067% per transfusion.
This remarkably low number is thanks to rigorous testing protocols that include screening donated blood for HIV using nucleic acid testing (NAT), which can detect HIV sooner after infection than traditional antibody tests.
But There's a 90-95% Risk In Poorer Countries
However, in settings without such stringent blood screening measures, the risk can be significantly higher. Historically, before widespread screening of the blood supply was implemented, the per-act risk of HIV transmission from an infected blood transfusion was estimated to be close to 90-95%, meaning that nearly all recipients of HIV-infected blood would become infected themselves.
It's important to note that these figures can vary based on the specific measures in place for blood screening and the prevalence of HIV in the donor population. With current blood safety protocols in places like the U.S., the risk is extremely low, reflecting one of the great successes in public health measures to prevent HIV transmission.
Never mind transfusions-- Can The Semen Of An Hiv-Infected Man Put A Surrogate Mother Or A Baby At Risk?

How Scientists Calculate The Likelihood of Getting HIV
Research Methodologies
Diving into the world of HIV risk estimation is like entering a complex labyrinth of numbers, studies, and models. Scientists have developed various methodologies to navigate this maze, each with its strengths and challenges. Let's unravel these methods to understand how we arrive at the numbers that guide our risk perceptions and decisions.
The Backbone of HIV Research: Cohort Studies
Cohort studies stand as the bedrock of HIV transmission risk research. These studies follow groups of people over time to observe how HIV transmission occurs under different circumstances. Think of them as long-term surveillance cameras, capturing the intricate dance of variables that influence HIV risk.
In a typical cohort study focusing on HIV, researchers might track a group of HIV-negative individuals who are at high risk for HIV due to their behaviors, such as men who have sex with men (MSM), and periodically test them for HIV. By monitoring who becomes infected and under what circumstances, researchers can start to tease out the per-act risk of various sexual activities.
However, cohort studies are no small feat. They require substantial time, resources, and the ethical navigation of tracking individuals' health statuses without intervening. The richness of data they provide comes with the caveat of potential biases—participants might alter their behaviors because they know they're being observed, or they might not accurately report their behaviors.
The Power of Case-Control Studies
Case-control studies offer another lens through which to view HIV probability. These studies compare individuals who have contracted HIV (cases) with those who haven't (controls), looking back in time to determine exposure levels to different risk factors. It's akin to a detective meticulously piecing together the events leading up to a mystery outcome, in this case, HIV infection.
This retrospective approach allows researchers to quickly gather insights into risk factors associated with HIV transmission. However, the reliance on participants' memories and the selection of a suitable control group can introduce recall and selection biases, potentially skewing the results.
The Role of Mathematical Modeling
When direct observation via cohort or case-control studies isn't feasible, mathematical modeling steps into the spotlight. Models are like the theoretical physicists of HIV research, using mathematical formulas to simulate the complex interplay of behaviors, biological factors, and epidemiological trends that influence the probability of contracting HIV.
These models can incorporate data from various sources, including cohort and case-control studies, to estimate risks under different scenarios. They're especially useful for exploring "what if" questions and predicting future trends. For instance, a model might simulate the impact of increased condom use among a population on HIV transmission rates.
But, as with any simulation, the output is only as good as the input. The assumptions and parameters fed into the model must be carefully chosen and based on solid data; otherwise, the results might not reflect reality.
Trust and Accuracy in Risk Estimation
Among these methodologies, no single approach is deemed the "gold standard" in isolation. Each has its strengths and contributes a piece to the puzzle of understanding the risks of contracting HIV. However, when findings from different methodologies converge, the scientific community gains confidence in the results.
Cohort studies, with their direct observation over time, often carry significant weight, especially when their findings are supported by case-control studies and mathematical models. The consistency across diverse research approaches bolsters the trustworthiness of the risk estimates.
Navigating the Numbers
Understanding the science behind HIV risk estimation is more than an academic exercise; it's a practical tool for informed decision-making. By grasping how researchers arrive at the numbers, we can better interpret what they mean for our lives. Whether a number provides reassurance or a cautionary tale, its power lies in its ability to inform our choices and actions in the pursuit of health and well-being.
As we navigate the complexities of HIV risk, it's crucial to remember that behind every statistic are rigorous scientific endeavors aimed at illuminating the path to safer, more informed sexual health choices.
These adjustments underscore the variability in risk and how individual factors can lead to significantly higher transmission probabilities, reinforcing the importance of protective measures like condoms and PrEP, even when the baseline per-act risk might seem low.
Other Ways You Can Get HIV Sexually
Kissing
Casual kissing is generally considered safe with no risk of HIV transmission. The virus cannot be transmitted through saliva alone, and the quantity of virus in saliva is typically too low to pose a risk. However, deep or "French" kissing might carry a very minimal risk if there are open sores or bleeding gums in the mouth, though such instances of transmission are extremely rare and not well-documented.
Mutual Masturbation
This activity is considered safe regarding HIV transmission. The risk becomes negligible unless there are open wounds on the hands or genitals that come into direct contact with HIV-infected bodily fluids.
Use of Sex Toys
The risk associated with using sex toys depends on whether the toys are shared and if they are cleaned between uses. Sharing sex toys without cleaning or covering them with a new condom each time can pose a risk for HIV transmission if the toys are contaminated with HIV-positive blood, semen, or vaginal fluids. Proper cleaning or using barriers like condoms on sex toys can significantly reduce this risk.
Online HIV Chance Calculators
In the digital age, online tools and HIV chance calculators have emerged as valuable resources for individuals seeking to understand their personal risk of HIV transmission.
These tools, ranging from simple calculators to more comprehensive risk assessment applications, offer a way to gauge potential risks based on individual behaviors and circumstances. Let's explore the landscape of these online resources, their accuracy, utility, and where to find the most reliable ones.
Online HIV risk calculators vary widely in complexity and the factors they consider. Basic calculators might ask a few simple questions about sexual behavior, condom use, and partner's HIV status to provide a rough estimate of risk.
More sophisticated tools incorporate a broader range of variables, including the type of sexual activity, frequency, drug use, and even geographical location, given the varying prevalence rates of HIV in different regions.
These calculators often use data from epidemiological studies and research on HIV transmission risks to generate personalized risk assessments. By inputting specific behaviors and circumstances, users can receive an estimate of their risk for HIV in a given encounter or over a period. Here are 4 we like:
Centers For Disease Control (CDC)
Northwestern University HIV Risk Calculator

Evaluating The Accuracy and Utility Of HIV Chance Calculators
The accuracy of online HIV risk calculators depends on several factors, including the quality of the data they're based on and the comprehensiveness of the questions they ask. Calculators that use up-to-date research and consider a wide range of behaviors and factors are generally more reliable. However, it's crucial to recognize the inherent limitations of these tools. They can provide risk estimates but cannot account for every possible variable or unique individual circumstances.
The utility of these calculators lies in their ability to raise awareness and prompt individuals to reflect on their behaviors and potential risks. They can be an excellent starting point for conversations about safer sex practices and the need for regular HIV testing. However, they should not replace professional medical advice or be used as the sole basis for making decisions about one's sexual health.
Difference Between Prevalence Rate and Per Act Percentages
What is the likelihood of contracting HIV? We've been answering that question with per-act percentages not prevalence rates. That's because prevalence rates and per-act percentages are not the same. They measure different aspects of disease and risk:
Prevalence Rates:
- Definition: Prevalence rates refer to the proportion of a population that has a specific condition or disease at a given time. It's a snapshot that tells you how widespread an infection or disease is within a population.
- Usage: Prevalence is used to understand the burden of a disease in a community or population and can inform public health strategies and resource allocation. It's typically expressed as a percentage or as the number of cases per a certain number of people (e.g., per 1,000 or 100,000 individuals).
Per-Act Percentages:
- Definition: Per-act percentages represent the risk of transmission of an infection or disease from a single exposure or act, such as one instance of unprotected sex, one shared needle use, etc.
- Usage: This measure is crucial for understanding the risk associated with specific behaviors or exposures. It helps individuals assess the risk of engaging in a particular activity and can guide behavior change or the adoption of protective measures.
In essence, while prevalence rates give an overview of how common a disease is within a group at a certain time, per-act percentages quantify the risk of acquiring the disease from a single event or behavior. Both are important in the field of public health but serve different purposes in understanding and addressing diseases.